
Playwright Reporting: From Console Output to HTML Dashboard to Allure
- Anuradha Agarwal
- Mar 5
- 8 min read

As our Playwright automation framework evolves, it gradually incorporates several important capabilities:
Project dependency setup
Global login using storage state
Parallel regression execution
Smoke E2E workflows
With these components in place, our tests begin to resemble a real production automation framework rather than simple scripts.
At this stage, an important question naturally arises:
How do we understand what actually happened during test execution?
Running tests is only part of the story. A mature automation framework must provide clear visibility into execution results.
We need to know:
Which tests ran
How many passed or failed
Which browser executed them
How long they took
What failed and why
Without proper reporting, test automation becomes difficult to debug and nearly impossible to scale in CI/CD environments.
This is where Playwright’s reporting capabilities become essential.
In this tutorial, we will progressively build our reporting strategy:
Console reporting for quick execution feedback
HTML reports for visual inspection and debugging
Debug artifacts such as screenshots, videos, and traces
Allure reporting for enterprise-style dashboards and CI/CD integration
By the end of this section, our framework will provide clear visibility, debugging support, and shareable reports—key characteristics of a professional test automation setup.
Step 1 — Console Reporting
When we run:
npx playwright testThis is what we get in the console:
In our configuration, we explicitly enabled it:

Here:
"line" → controls console output
"html" → generates the visual report
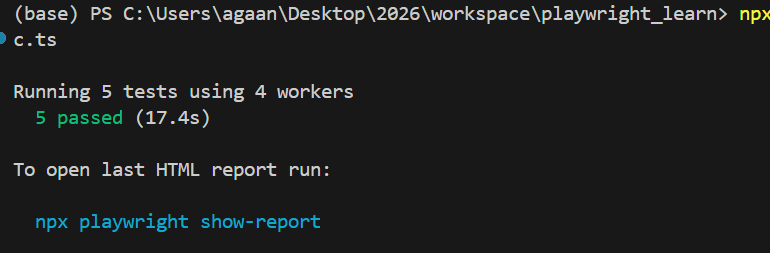
The console output shows that 5 tests were executed in parallel using 4 workers, including the setup (login) project and the main Chromium test project, and confirms that all tests passed in 17.3 seconds. This provides quick feedback during development or CI runs and helps validate specific test groups using filters like --grep.
Step 2 — HTML Reporting (Visual Dashboard)
While console output gives quick feedback, it is limited.
For deeper inspection, Playwright generates a full HTML report.
After execution, Playwright tells us:
To open last HTML report run:npx playwright show-reportWhen we run:
npx playwright show-reportIt opens a browser dashboard.

From the above screenshot, the report shows:
✔ Setup Project
global.setup.tsglobal setup: login and save storageStateThis confirms:
The setup project executed successfully
Storage state was created
Authentication was successful

✔ Regression Suite
We see:
Shop search test
Price filter validation
Cart verification
E2E smoke workflow
Each test shows:
Execution time
Browser used (chromium)
Tags (@regression, @smoke)
File and line reference

Why HTML Report Is Powerful
The HTML report provides:
Pass/Fail breakdown
Test grouping by file
Project execution separation (setup vs chromium)
Step-level details (from test.step())
Attachments (screenshots, videos, traces if enabled)
This becomes your debugging control centre.
Step 3 — Adding Debug Evidence (Screenshots, Video, and Trace)
The HTML report already gives us a good overview of test execution. However, when a test fails in a real automation environment, simply knowing that it failed is not enough.
We need evidence to understand what actually happened.
For example:
What was visible on the screen when the test failed?
Did the UI behave differently than expected?
Did the page load slowly, or did an element disappear?
Which exact action caused the failure?
To answer these questions, Playwright can automatically capture debug artefacts during test execution.
These include:
Screenshots
Video recordings
Trace files
These artifacts are visible directly within the HTML report.
Configuring Debug Artifacts in Playwright
We enable this inside playwright.config.ts using the use configuration.

What Each Option Does
Screenshot
screenshot: "only-on-failure"Captures a screenshot when a test fails.
This helps quickly identify UI problems such as:
missing elements
layout issues
incorrect page navigation
Video Recording
video: "retain-on-failure"Records a video of the entire test execution and keeps it only if the test fails.
This allows us to watch the exact sequence of actions that led to the failure.
Trace Viewer
trace: "retain-on-failure"Trace is one of Playwright’s most powerful debugging tools.
It records:
every action performed
network requests
console logs
DOM snapshots
timing information
When a failure occurs, the trace file can be opened directly from the HTML report to replay the test step-by-step.
To see these in action, let's intentionally fail the test by changing the locator name to a wrong value

To demonstrate this, we will intentionally broke a locator in the cart validation step:

This caused the smoke test to fail with a timeout:
waiting for locator('table.cart tr.cart_item').first().locator('td.product-name2')
This is exactly where Playwright’s debug artifacts become extremely valuable.
What Playwright captured automatically (Console proof)
Because we enabled these options in playwright.config.ts:
use: { screenshot: "only-on-failure", video: "retain-on-failure", trace: "retain-on-failure",}Playwright automatically attached evidence in the console output:
✅ Screenshot → test-failed-1.png
✅ Video → video.webm
✅ Trace → trace.zip with a command to open it
You can literally see the artifacts paths printed in terminal, which is very helpful in CI logs too.

Retries are also visible

So Playwright retried the failing smoke test:
And for each retry, Playwright created a separate folder:

That is extremely useful because sometimes:
Failure happens only on the first run
retry passes (flaky behaviour)
or a different failure happens on retry (timing-related issues)
HTML Report View (Where evidence becomes visual)
When you open the report:
npx playwright show-reportYou can clearly see:
Clicking View Trace opens Playwright Trace Viewer.
Trace Viewer is not a screenshot—it is a full replayable timeline.
It contains:
every action Playwright performed
before/after DOM snapshots
network calls
console logs
errors
exact step where Playwright got stuck
This makes debugging dramatically faster.
When should we enable screenshot/video/trace in a framework?
This is an important framework decision, because artifacts can increase disk usage.
✅ Recommended for local development
When you’re actively building tests or debugging flaky behaviour:
screenshot: "only-on-failure"
video: "retain-on-failure"
trace: "on-first-retry"
Why trace: on-first-retry is smart
Traces are heavier than screenshots
Capturing trace only when a retry happens is often enough
It is a great balance between debugging power and storage
✅ Recommended for CI/CD pipelines
In CI, we usually care about:
evidence only when tests fail
keeping artifacts small
uploading only what matters
Best-practice CI setup:
use: {
  screenshot: "only-on-failure",
  video: "retain-on-failure",
 trace: "retain-on-failure",
}
And then configure CI to upload:
playwright-report/ (HTML report)
test-results/ (screenshots/videos/traces)
So even if you don’t have access to the machine where tests ran, you still get everything needed for debugging.
Copy prompt button
In our HTML report error panel, Playwright shows a Copy prompt button.
This helps you quickly copy:
the error message
call log
stack trace
relevant snippet
It’s useful when you want to:
paste into Jira/bug report
Share with a developer
Share with llm (for fast debugging help)
Allure Reporting Setup
Playwright’s built-in HTML report is already very powerful for debugging. But in teams, we often need a more “stakeholder-friendly” dashboard—something that looks consistent across frameworks, supports trends, and is easy to publish in CI/CD.
That’s where Allure Reporting comes in. Allure generates a rich, interactive report with test summaries, suites, steps, attachments, and history (when integrated with CI).
Why Use Allure Report?
Allure is commonly used in enterprise automation because it provides:
A clean dashboard view for test execution results
Test grouping by suite and feature (useful for large projects)
Detailed step visibility (your test.step() blocks appear nicely)
Attachments support (screenshots, videos, traces, logs)
CI/CD-friendly publishing (results can be stored and reports generated later)
Prerequisite: Install Java (JDK)
Allure CLI is Java-based, so you need JDK 8+ installed (JDK 11/17 recommended).
Verify Java:
java -versionIf Java is not installed, install JDK 17 (LTS) and re-run the command to confirm.

Step 1 — Install Allure Packages
From your Playwright project root:
npm install -D allure-playwright allure-commandlineallure-playwright → generates Allure result files during Playwright test runs
allure-commandline → builds and serves the final Allure HTML dashboard

After installation, your devDependencies will contain something like:

Step 2 — Enable Allure Reporter in playwright.config.ts
Add Allure as an additional reporter :

This means:
You still get terminal output (line)
You still get Playwright’s HTML report (html)
And now you also generate Allure results (allure-playwright)
Step 3 — Run Tests
Run your test suite:
npx playwright test tests/globalsetup_purchase_workflow_demostore.spec.ts
After the run completes, Playwright will automatically create:
allure-results/
This folder contains raw JSON + metadata that Allure uses to build the report.

Step 4 — Generate and Open the Allure Report
The easiest command is:
npx allure serve allure-resultsThis will:
Generate the report
Start a local server
Open the Allure dashboard in your browser
It will also create:
allure-report/ (the generated HTML report output)

Recommended: Add Allure Scripts in package.json
To make commands easier, add these scripts:
"scripts": {
 "test": "playwright test",
"allure:serve": "allure serve allure-results",
"allure:generate": "allure generate allure-results --clean -o allure-report",
"allure:open": "allure open allure-report"
}
Now you can run:
npm run allure:serveMaking Allure Reports Useful for Debugging
Allure becomes even more valuable when combined with Playwright’s failure artifacts. Keep these in your config:
use: {
screenshot: "only-on-failure",
video: "retain-on-failure",
trace: "retain-on-failure"}
Now, when a test fails, you will have:
Screenshot evidence of the failure screen
Video playback of the test run
Trace viewer replay for deep debugging

These artifacts are perfect for sharing with developers and investigating flaky failures in CI.
Additionally, Add Allure + Playwright artifacts to .gitignore
Add these entries:

Why:
allure-results/ and allure-report/ are generated artifacts
test-results/ and playwright-report/ can be huge
state.json contains authentication state (never commit)
If you want allure-report/ inside your project
Use generate instead of serve:
npx allure generate allure-results --clean -o allure-reportThen open it:
npx allure open allure-reportNow you’ll see this folder inside your repo:
allure-report/Folder structure so far:

At this point, our Playwright framework provides multiple layers of reporting and visibility.
We started with console reporting, which gives quick feedback during local development and CI runs. This helps verify which tests executed and how they performed.
We then explored the Playwright HTML report, which offers a structured dashboard with test grouping, execution time, browser details, and step-level insights. This report becomes the primary tool for analyzing test runs.
Next, we enhanced our debugging capabilities by enabling screenshots, video recordings, and trace files. These artifacts provide critical evidence when tests fail, allowing us to replay test execution and quickly identify root causes.
Finally, we introduced Allure reporting, which adds a richer reporting experience suitable for enterprise automation environments. Allure provides a clean dashboard, structured test suites, attachments, and CI/CD-friendly reporting that teams can easily share.
Together, these reporting layers transform simple test execution into a fully observable automation framework.
Enhancing Global Setup: Cleaning Previous Test Artifacts
For the introduction on the global setup, refer this
Now that our framework generates multiple types of reports and artifacts:
Playwright HTML reports
Allure results
Screenshots, videos, and traces
another practical question arises:
What happens if old artifacts from previous test runs remain in the project?
If these folders are not cleaned, several problems can occur:
Old results may mix with new test runs
Allure dashboards may show outdated data
Debug artifacts can grow very large over time
Reports become harder to interpret
To prevent this, it is good practice to clean up previous reporting artefacts before test execution begins.
Because we are using Playwright project dependencies, our setup project runs before all other test projects. This makes it an ideal place to perform framework initialisation tasks such as:
cleaning old report folders
preparing environment variables
generating authentication state
Cleaning Reports Inside the Setup Project
Inside global.setup.ts, we can remove old reporting folders before running login.
import { test, expect } from "@playwright/test";
import fs from "fs";
import path from "path";

test("global setup: clean reports and login", async ({ page }) => {

  const foldersToClean = [
    "playwright-report",
    "test-results",
    "allure-results",
    "allure-report"
  ];

  for (const folder of foldersToClean) {
    const folderPath = path.join(process.cwd(), folder);
    if (fs.existsSync(folderPath)) {
      fs.rmSync(folderPath, { recursive: true, force: true });
      console.log(`Cleaned folder: ${folder}`);
    }
  }
})

  // Continue with login setup

test("global setup: login and save storageState", async ({ page }) => {
  // const baseURL = "https://qa-cart.com";
  const storageStatePath = "state.json";

const username = process.env.DEMO_USER;
const password = process.env.DEMO_PASS;

if (!username || !password) {
  throw new Error("Missing DEMO_USER or DEMO_PASS in .env file");
}

  await page.goto("/");

  await expect(page.getByRole("heading", { name: /login/i })).toBeVisible();

  await page.locator("input[name='username']").fill(username);
  await page.locator("input[name='password']").fill(password);

  await page.getByRole("button", { name: /log in/i }).click();

  // Verify login on a stable page
  await page.goto('/');
  await expect(page.getByRole("link", { name: /log out|logout/i }).first()).toBeVisible();

  // Save login session
  await page.context().storageState({ path: storageStatePath });
});
Now the execution flow becomes very clean:
setup project starts
      ↓
old reports removed
      ↓login executed
      ↓storageState generated
      ↓main test projects start
Every run now begins with a fresh reporting environment.


Comments